|
11/7/2018 0 Comments Girls Game 1 (1-0 Record)@ Connersville (71-17 W) I went to the girls' first regular season game on November 1st, 2018 against Connersville with Devon. This was the first time we had taken statistics for a regular season game live. It went well for the most part; however, we did miss a couple of statistics. We knew right away and that we would have to go back and check the film to make corrections. Like I said previously, we did miss a couple of statistics live. So, I went to Hudl (the website where the film is held) and rewatched the entire game to make sure that every statistic was correct. Typically, MaxPreps or Hudl itself will have statistics from the game; however, they did not have statistics for this game for some reason. Ergo, I had to go back and rewatch the game. Below there are two screenshots of how I went back and recorded the statistics (again). The first screenshot is just what we used during the game, but on the computer - to save paper. I used one of these charts for each lineup. I used tally marks to indicate how many of each statistic each player had. The second screenshot is an example of how I totaled up each statistic for each player. The different colors (red, blue, green, and yellow) show their statistics for each quarter. Then, I used the SUM function in Excel to calculate my totals. The numbers in the "Totals" row that are highlighted in yellow are statistics that were different from our school website. Mr. Smith, our sports writer, told me that the statistics he put on the website were just the live statistics that the coaches gave him. He said that some of them would most likely be wrong - which some were. Anyways, to the right of the totals, I showed that both Devon and I confirmed that the school website was incorrect and that we were correct. For the NPHS Analytics Workbook (the third screenshot), I ended up using the statistics that I recorded while watching the game again and entered them into the Excel Sheet. This "workbook" tells me, the players, and coaches in-depth statistics of the team overall and each player individually. After I completed this workbook page for the game, I shared it with the coach - Mrs. Gizzi.  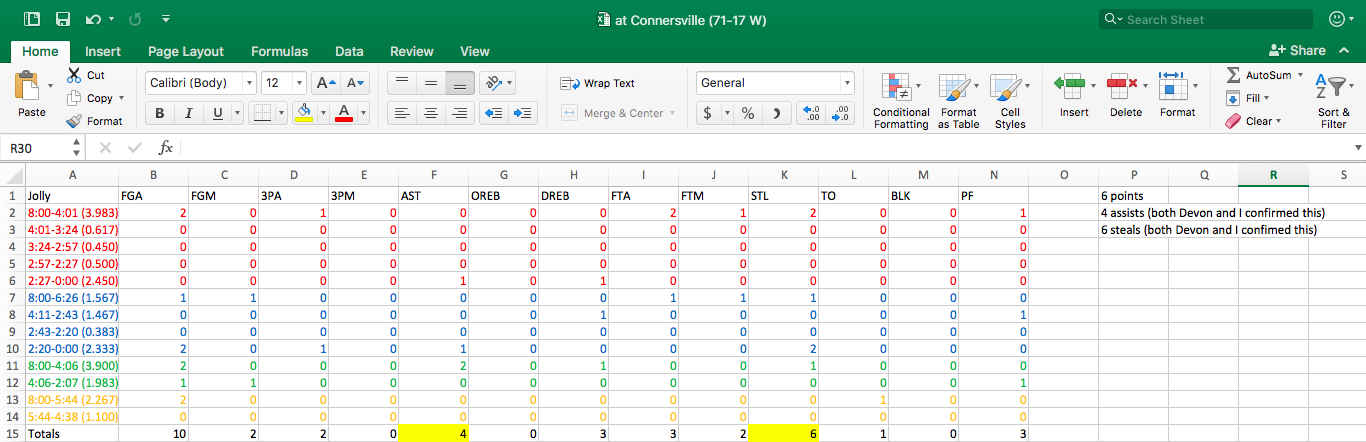 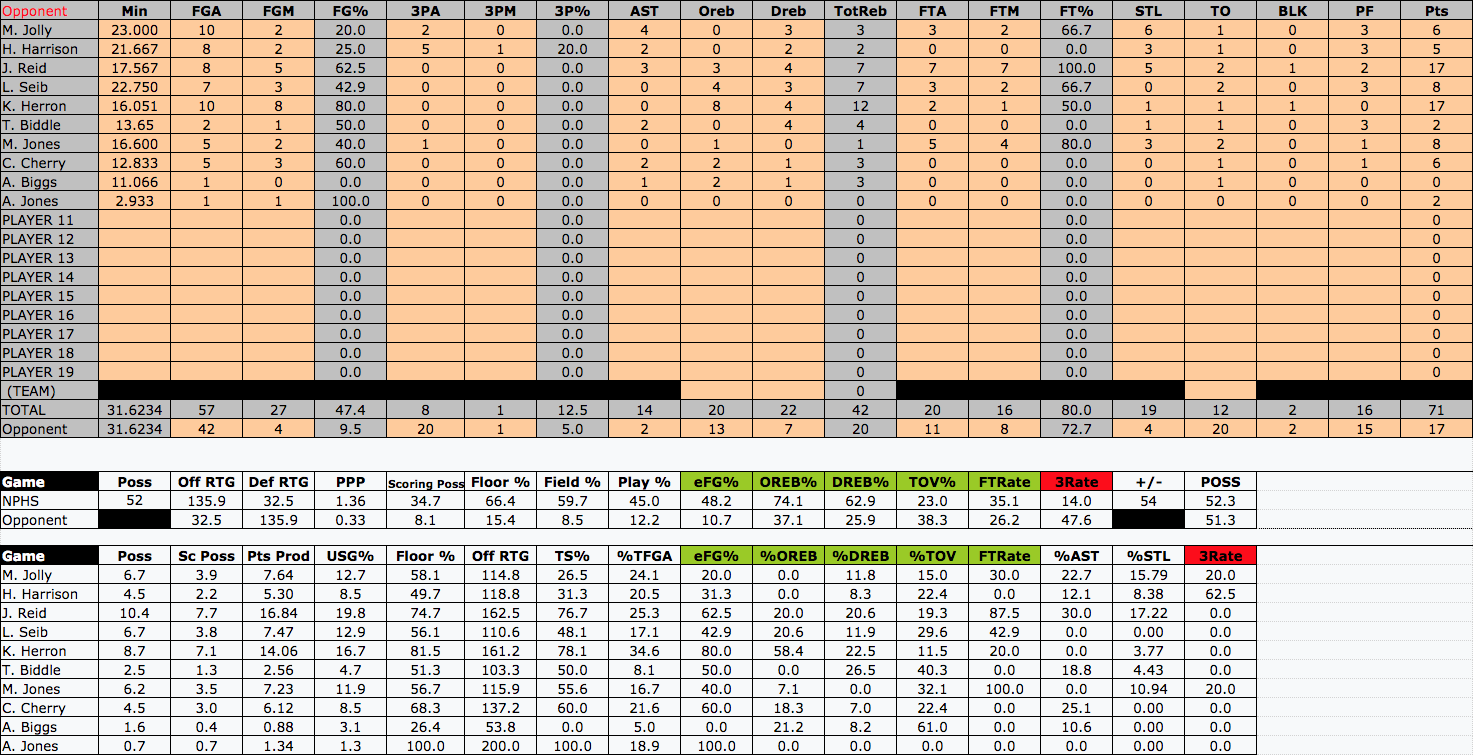
0 Comments
10/19/2018 0 Comments Preparing for the (Girls) seasonNPHS Girls Basketball
The girls basketball season starts up soon. In fact, they scrimmage Triton Central on October 25th, 2018 at 6:00 p.m. (ET). After that scrimmage, their regular season starts up a week later against Connersville. Instead of just taking statistics for the boys, we have decided to take statistics for the girls too. Getting Ready In order to get ready for the season, I have practiced taking statistics with film from last year. It will only be Devon and me taking statistics for the girls so it will be a little more challenging, but we will manage. However, for the boys, we will have a little more help. Alex will help us throughout the season when it comes to boys. Another thing I have done in order to help get me ready for the season was print out the schedules for each team - the boys and girls - and look at which games I will be able to make it to because sometimes their games conflict. For example, on Friday, December 28th, 2018, the boys have a tournament at Decatur Central at 10:00 a.m. (ET) while the girls have the Holiday Invitational at 10:00 a.m. (ET). We have decided to go to the boys' tournament and because of this, we will have to go back to the film and take statistics for the girls' games. Communicating With Coach Gizzi I have been keeping in touch with Coach Gizzi on a week-to-week basis. I have been emailing her whenever I have any questions related to the team and she has been very helpful! I first communicated with her when I asked her if she wanted me to take statistics for the team this upcoming season. She was really excited about the opportunity that I presented her with because she had never had anything like this before. Another example of me communicating with her was when I emailed her this past week about the rosters so I could put together each lineup on the stat sheet. BAM Analytics - what is it? BAM Analytics is a program that was created by Andrew McClatchey and Trevor Baker. In fact, "BAM" came from their last names and "BAM" means "Baker and McClatchey." To continue, BAM Analytics is a program that runs data analytics on gathered data once entered into the program - an excel sheet with many formulas. For example, for our project, we will take statistics from games and then enter them into the excel sheets (the program) that were created by these two individuals. Why did I choose to do this project? I chose to do this project - take statistics for the basketball teams - because I love numbers and basketball. The fact that an individual can look at a players' statistics and get a good idea of how good they are fascinates me. Ergo, I will be taking statistics with a couple of my peers and will get an in-depth look of how each player is performing each game throughout the season. Process 1. Collect box score data from games. 2. Enter the data/statistics into the spreadsheet. 3. Analyze the data. 4. Provide Coach Whitaker with a weekly summary of these statistics. Goals - Help the team become more efficient as a team. - Help the team recognize their own strengths and weaknesses. - Help "scout" other teams. - Help the team win more games by providing them with these statistics. Project Proposal We presented a project proposal to the administrators of our school. We made a PowerPoint of what it was, our objectives, why we chose the project, what standards it fulfilled, and the process of taking statistics. At the end of our presentation, we had the administrators ask questions or make comments. Some intuitive ideas were given to us. They also encouraged us to keep trying to work our way towards this as a career - if we want to. 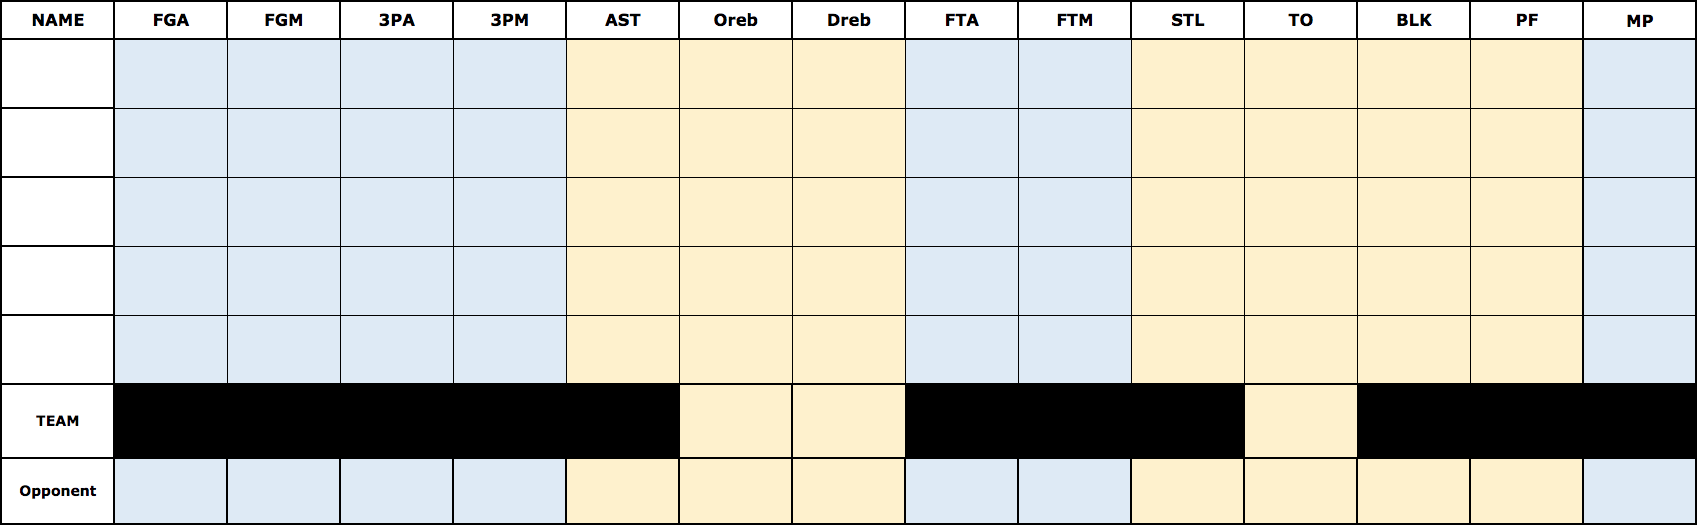 The photo above is a photo of the stat sheet that we will be using each game. At each game, our crew will fill out this sheet. We will use tally marks to mark everything. We have a separate stat sheet for each possible lineup. 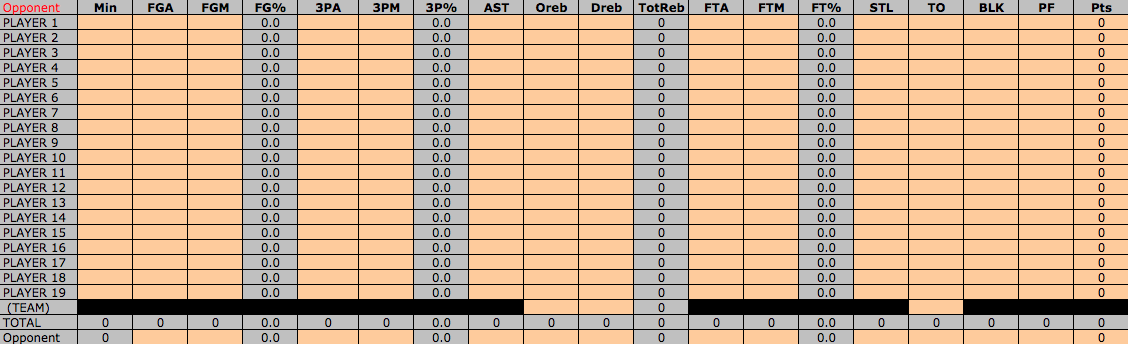 The photo above is the first part of our "Analytics Workbook." After each game, we will enter all of the stats we took during the game into the excel sheet. 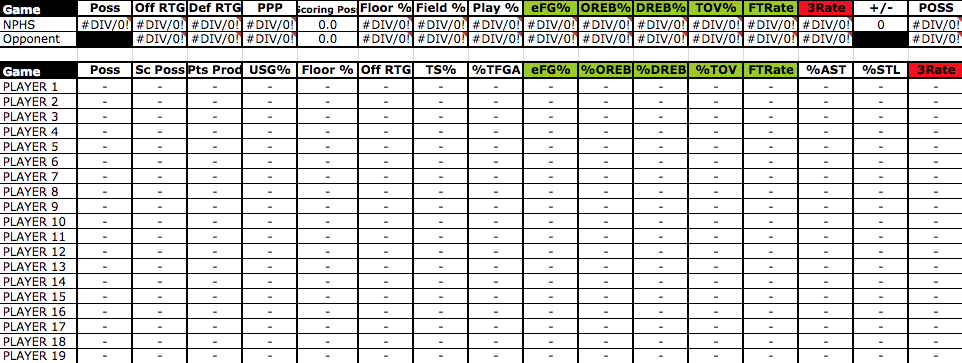 The photo above is the second part of our "Analytics Workbook." Like previously stated, we will enter the stats we recorded during the game into this part of the excel sheet.
|
 RSS Feed
